





Summary
A comprehensive guide to managing columns in custom report templates, including adding and removing columns, reordering, formatting data types, and applying conditional formatting rules.
Introduction
When creating custom report templates, the Configure columns step gives you full control over which columns appear in your report and how they are displayed. You can select specific fields, reorder columns, apply data formatting (text, numbers, dates, percentages), and set conditional formatting rules that highlight important data based on cell values. This guide covers all column management features available when building report templates. For a complete overview of the Reports section, refer to Reports: An Overview of the Reports Section in LMS
Steps to Follow
Accessing Rows Adjustment
Navigate to Reports > New Report Template.
Select a Report type from the dropdown.
Enter a Template name, then click Next: Configure columns.
The Configure columns step displays all currently selected columns for your report template. Each column appears as a row in the Columns list. Editing an existing template opens the same two-step wizard, with its saved settings already filled in.
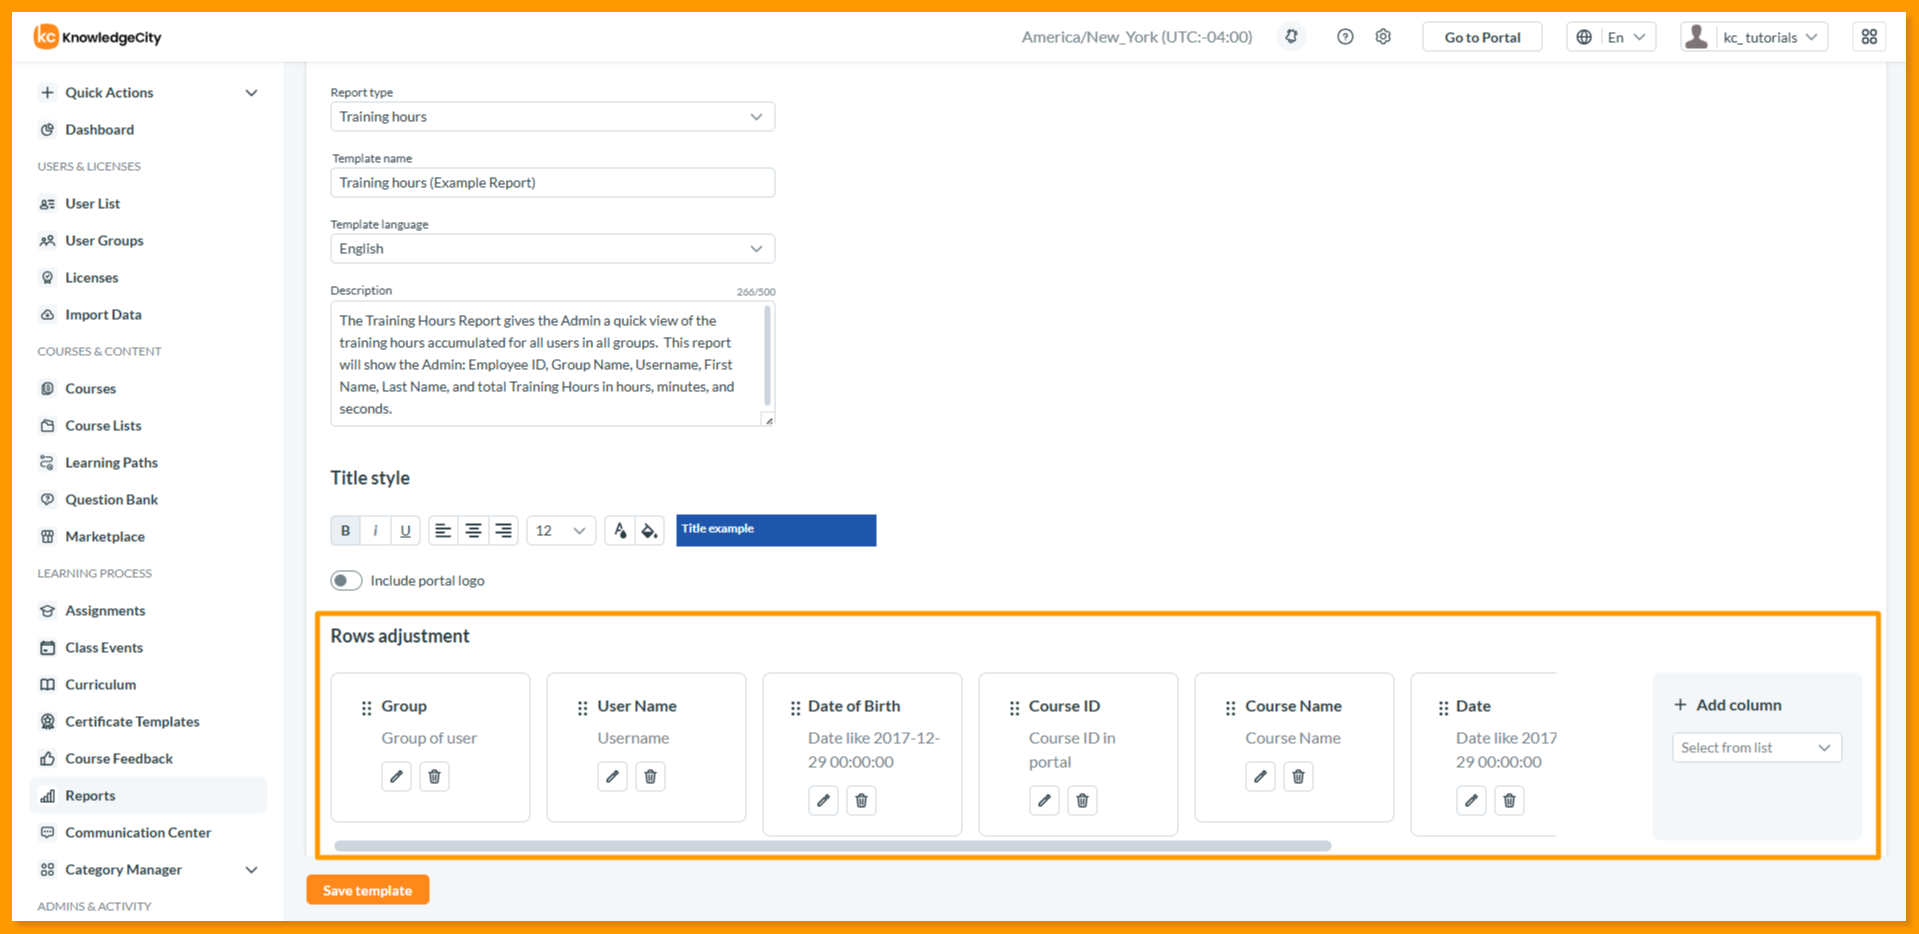
How to Add Reports Column
To add new columns to your report:
Click the Add column button.
A dropdown appears listing the fields that are not already selected for this report. Use the search box to narrow the list.
Tick the checkbox for each field you want, or use Select all, then click Done.
The new columns appear at the end of the Columns list.
How to Remove Reports Column
To remove a column from your report:
Locate the column you wish to remove in the Columns list.
Click the Delete button within the column.
The column is immediately removed from the list.
How to Reorder Reports Columns
To change the order in which columns appear in your report:
Locate the column you wish to move.
Click and hold the Drag handle (⋮⋮) within the column.
Drag the column up or down to the desired position.
Release to place the column in its new position.
How to Edit Column Settings
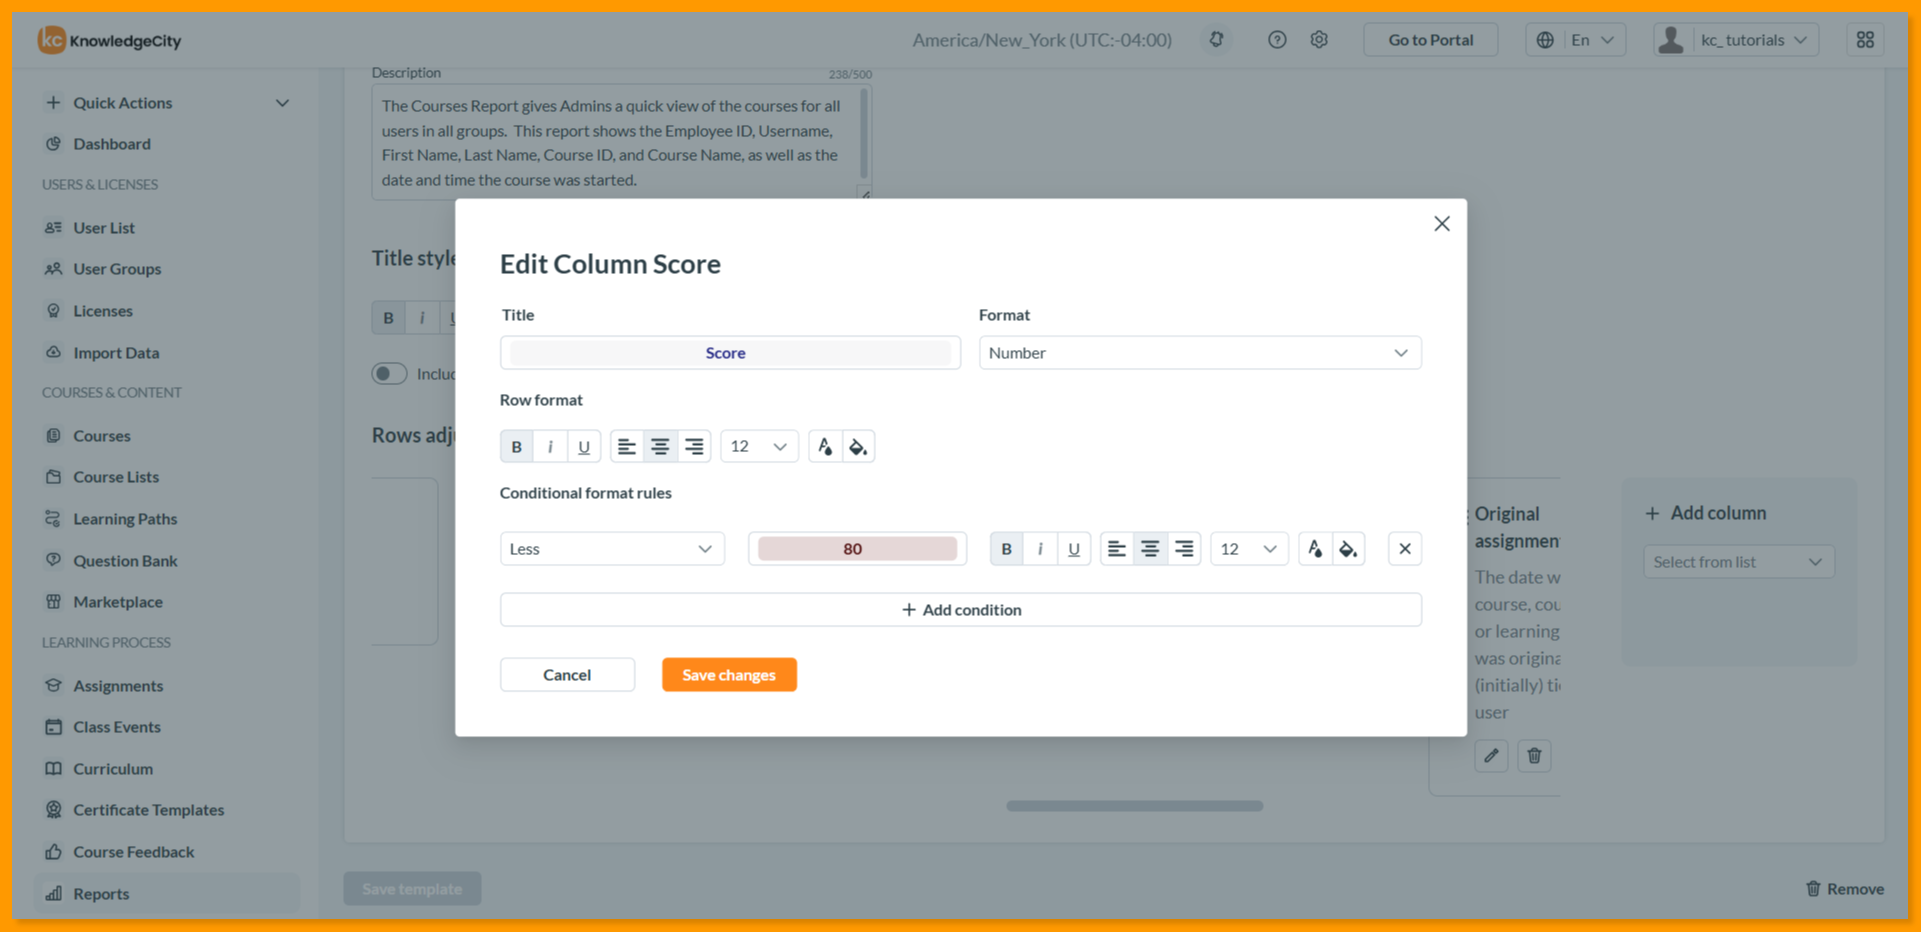
Click a column in the Columns list to open its Column Settings panel. This panel contains four configuration areas:
1. Title
Specify a title for the column. By default, the field name is used. To override it, enter your preferred title in the field.
2. Format
Select how the column data should be displayed. The available conditional format rules depend on the type of format selected:
Format Option | Description | Example |
|---|---|---|
Default | Standard display as stored in the system | Text/ data as entered |
Text | Plain text format | "John Doe" |
Number | Numeric values with optional decimal places | 1,234.56 |
DateTime YYYY-MM-DD | Date in year-month-day format | 2026-03-30 |
DateTime dd/mm/yy | Date in day/month/year format | 30/03/26 |
Time h:mm AM/PM | Time in 12-hour format | 2:30 PM |
Time h:mm | Time in 24-hour format | 14:30 |
Percentage % | Numeric values as percentages | 78.5% |
3. Row Format
Apply text styling to the title of the column using the formatting toolbar:
Bold: Makes text heavier.
Italic: Slants the text.
Underline: Adds a line beneath text.
Font size: Adjust text size (options from 10 to 24).
Alignment: Left, center, or right align content.
Text color: Choose a color for the text.
Background color: Choose a color for the cell background.
4. Conditional Format Rules
Conditional formatting applies specific styling to cells that meet defined criteria. This helps highlight important data such as overdue assignments, low scores, or completed courses.
How Conditional Formatting Works:
Click Add condition to create a new rule.
Select the condition type based on your format selection.
Specify the value to compare against.
Apply styling to row values (bold, italic, underline, text color, background color).
Multiple conditions can be added to the same column.
Condition Types by Format Selection:
Format | Available Conditions |
|---|---|
Text / Default | Cell is empty, Cell is not empty, Text contains, Text does not contain, Text starts with, Text ends with, Text is exactly |
Number / Percentage | Greater than, Greater than or equal, Less than, Less than or equal, Equal to, Not equal to |
Date | Date is, Date is before, Date is after |
Example Use Cases for Conditional Formatting:Highlight overdue assignments in red when the date is before today.Mark completed courses in green when status equals "Passed".Flag low quiz scores in orange/red when score is less than 80%.
Example Use Cases for Conditional Formatting:
Highlight overdue assignments in red when the date is before today.
Mark completed courses in green when status equals "Passed".
Flag low quiz scores in orange/red when score is less than 80%.
Saving Your Template
After completing all column adjustments:
Go to the Configure columns step.
Click Save template.
All column configurations, including order, formatting, and conditional rules, are saved with the template. The template appears in the Report Generation tab for generating report. For a new template, the Report Generation tab opens with the Run report window ready for it, so you can generate a report straight away.
Important Notes
Field availability: The Add column dropdown only shows fields that are available for the selected report type and not already added to your template.
Format affects conditions: The available conditional rule types change based on the format you select (Text, Number, Date, etc.).
Multiple conditions: You can add multiple conditional rules to the same column. If multiple rules apply to a cell, the first matching rule determines the styling.
Conclusion
You have successfully learned how to manage columns in custom report templates. By adding, removing, and reordering columns, applying appropriate data formats, and setting conditional formatting rules, you can create professional, easy-to-read reports that highlight the information that matters most to your organization.