





Summary
The Risk Matrix Report in Safety App presents a live heatmap that plots incident likelihood against impact, with every cell resolving to a numeric score and a color-coded severity band. It gives safety and risk teams an at-a-glance view of where risk concentrates so they can prioritize their response.
Introduction
The Risk Matrix Report is the view of the risk matrix that Safety App uses to score incident severity. It pairs the likelihood axis against the impact axis and renders the result as a grid of color-coded cells, so you can see how each likelihood and impact combination translates into a severity rating.
Safety and risk administrators use this view to interpret the same scoring framework that drives incident ratings across the product. Rather than reading individual scores in isolation, the report lets you see the full scale at once and understand why a given incident lands in Low, Medium, High, or Critical.
Key Concepts
- Likelihood axis: the probability dimension of the matrix, an ordered scale whose defaults run
Rare,Unlikely,Possible,Likely, andAlmost Certain. - Impact axis: the consequence dimension of the matrix, an ordered scale whose defaults run
Negligible,Minor,Moderate,Major, andCatastrophic. - Cell value: the numeric score held in each cell of the grid, calculated by default as likelihood multiplied by impact across a 5x5 layout, ranging from
1up to25. - Color map: the set of severity bands, where each band defines a minimum value, a maximum value, a color, and a label, so every score falls into exactly one band.
- Severity bands: the named levels a score maps to, with defaults of
Low(green),Medium(amber),High(orange), andCritical(red). - Score-to-color resolution: the logic that takes a chosen likelihood and impact, reads the resulting cell value, and matches it against the color map to assign the color-coded severity.
Steps to Follow
Open the risk matrix
Open the risk matrix from your account settings to load the current heatmap. In Settings, open the Account section and select the Risk Matrix tab. The view reflects the live matrix configuration, so the axes, cell values, and color bands you see match how your organization has set up its risk scale.
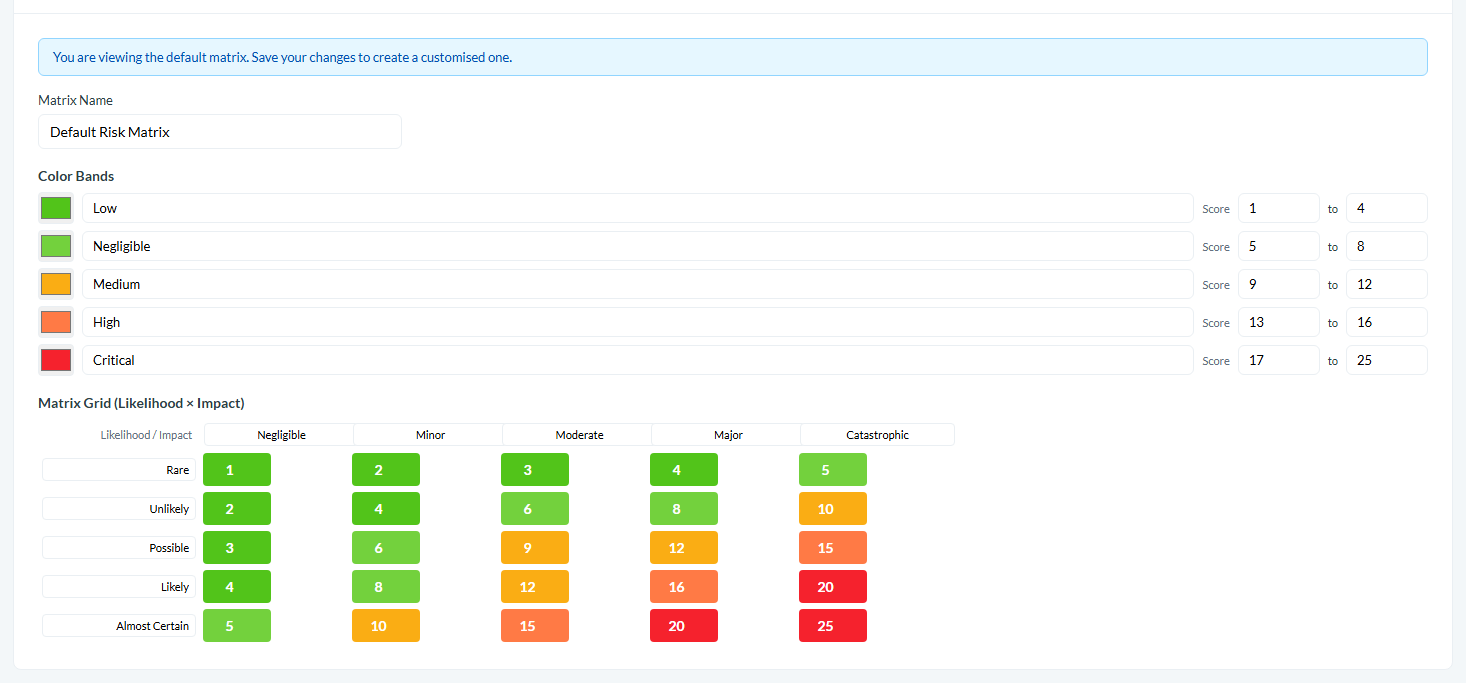
Caption: The risk matrix shows the color bands and the 5x5 Likelihood by Impact grid, with each cell scored from 1 to 25 and shaded by its severity band.
Read the axes
Identify the two axes before reading any cell. The Likelihood axis runs from the least likely level to the most likely, and the Impact axis runs from the lowest consequence to the highest. Because both axes are ordered, position along each axis is what drives the underlying score.
Interpret a cell value
Locate the cell where a likelihood level meets an impact level to read its score. By default each cell shows the value of likelihood multiplied by impact, so the grid rises from 1 in the lowest corner to 25 in the highest. This value is the raw severity score for that combination.
Read the color bands
Use the color of each cell to read its severity band. The Color map matches each score against a minimum and maximum range and assigns a color and a label. In the default configuration, low scores appear green for Low, mid-range scores appear amber for Medium, higher scores appear orange for High, and the top scores appear red for Critical.
Use the report to prioritize
Read the heatmap as a whole to see where risk concentrates. Cells in the red and orange bands mark the likelihood and impact combinations that warrant the most urgent attention, while green cells represent tolerable risk. Because the report uses the same score-to-color resolution that rates individual incidents, it helps you compare and prioritize incidents on a shared, consistent scale.
Conclusion
The Risk Matrix Report turns the underlying risk scale into a single, color-coded heatmap of likelihood against impact, letting you read severity scores and bands at a glance. By understanding the axes, cell values, and color map, you can interpret why incidents receive the ratings they do and focus attention where risk is highest.