





Summary
The Executive Dashboard gives safety leaders a single place to monitor performance across four areas: Incidents, Investigations, Training, and Trends. You move between these areas with a segmented toggle, and each view surfaces the metrics, comparisons, and indicators most relevant to that part of your safety program.
Introduction
The Executive Dashboard is the high-level reporting surface of the Safety App. Instead of drilling into individual records, it rolls up your organization's safety data into summary views designed for executives, safety managers, and other leaders who need an at-a-glance picture of how the program is performing.
It solves the problem of scattered reporting. Rather than compiling incident logs, investigation outcomes, and training completion separately, you can review key indicators, compare periods, and spot emerging trends from one screen, then switch focus between areas without leaving the dashboard.
Key Concepts
- Segmented toggle: A single control that switches the dashboard between its four views: Incidents, Investigations, Training, and Trends.
- KPI targets: Configurable performance targets shown alongside actuals, with actual-vs-target indicators (for example, green when on target and red when off target).
- Period comparison: Side-by-side metrics that let you compare one time period against another (for example, this quarter versus last quarter).
- Executive Safety Scorecard: A single-page summary that brings together headline measures such as TRIR (Total Recordable Incident Rate), trends, and period comparison.
- Cross-investigation trends: Aggregated insight across investigations, including top contributing factors, recurrence rates, location hotspots, and investigator workload.
- Training dashboard: A view of completion rates, overdue counts, and trends broken down by department.
Steps to Follow
Open the Executive Dashboard
Sign in to the Safety App and navigate to the Executive Dashboard. The dashboard opens on one of its views and displays the segmented toggle for switching between the four areas.
Switch between views with the segmented toggle
Use the segmented toggle to move between Incidents, Investigations, Training, and Trends. Selecting a segment refreshes the dashboard to show the metrics and indicators for that area. Your selection determines which summary content is displayed, so choose the view that matches what you want to review.
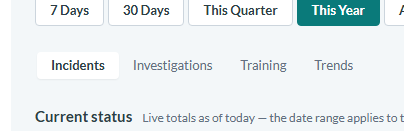
Caption: The segmented toggle switches the Executive Dashboard between Incidents, Investigations, Training, and Trends.
Review incidents and the safety scorecard
In the incident-focused view, review your headline safety measures, including the Executive Safety Scorecard with TRIR and related trends. Use the actual-vs-target indicators to see at a glance whether your KPI targets are being met, where on-target and off-target values are distinguished by color.

Caption: The Incidents view leads with TRIR, LTIR, DART Rate, and Open Incidents, followed by Avg Days to Close and Overdue Actions.
Review investigation trends
Open the Investigations view to see cross-investigation insight rolled up across your records. This includes top contributing factors, recurrence rates, location hotspots, and investigator workload, helping you understand patterns rather than individual cases.
Review training performance
Open the Training view to monitor completion rates, overdue counts, and trends by department. Use this to identify where training is on track and where follow-up may be needed.
Compare periods and read against targets
Where a view offers period comparison, use it to view metrics side by side across time periods so you can judge direction of travel, not just current values. Combine this with the KPI targets and their actual-vs-target indicators to assess whether performance is improving relative to your goals.
Conclusion
The Executive Dashboard consolidates incident, investigation, training, and trend reporting into one leadership-focused view. By switching areas with the segmented toggle and reading targets, comparisons, and scorecard measures together, you can quickly gauge safety performance and decide where to focus attention.